
Glasseye
Issue 20: December 2025
In this month’s issue:
The dunghill is full of AI slop. Will it drown us all or will apathy win the day?
Late Victorian machine learning creaks back into life in the white stuff.
And semi-supervised solves the riddle of the one-tailed test.
Plus quantum computing, semantic leakage, and a cold caller who undermines her own existence.
Does that not sound fun?

The dunghill
The dunghill would not be a proper dunghill if we did not, at least once, address the issue of slop. And ok, cards on the table, as you no doubt are well aware, this newsletter is awash with AI-generated images. (Look up, about an inch above this sentence - you’ll see a pitchfork with too many prongs.) But they are, I would like to argue, the good kind. They cost me effort. I had to think. AI slop, by contrast, is characterised by an obvious lack of effort, and no attempt at deeper meaning.
Whatever you think of my images, it seems likely that slop, lots of slop, is headed our way. It might be prudent, therefore, to size up the threat. What are we facing then, as data scientists and statisticians? To what extent will we become slop consumers and, despite our best intentions, slop producers?
First, it’s worth considering how we might become the victims, indirectly, of slop produced and consumed by others - perhaps those at the more visionary end of the AI adoption curve. I’m thinking in particular of the thousands of articles on the benefits of AI produced in the less-scrutinised industry magazines. Try dropping some of these into ZeroGPT, and you’ll see what I mean. A lot looks like slop, more worryingly, slop that tells your CEO what you and your team should be doing next.
Next, we should think about ourselves as direct consumers. It is particularly true in statistics and probability that the right answer is not always the most convincing or popular answer. Here, then, the strategy of “averaging the internet” does not seem wise, especially once we throw in hallucinations. Far more concerning, though, than chatbot output (which, after all, only becomes slop once we paste it somewhere) is the gradual undermining of our only real method of filtering out false claims - the peer-reviewed paper. The slop problem in paper writing is well known, and the peer-review process itself has the potential to deliver yet more slop. Yes, I know that the peer review process was already dysfunctional, with academics producing human-slop1 to chase citations, but automating the problematic part of this process is surely not the answer.
What about us? Do we produce slop? Already, if I leave an agent on in a markdown cell of a Jupyter notebook, I find that it is itching to write me a tedious but lengthy account of what is going on in the data. The temptation is there. Even if I resist, there’s every possibility that my work will be sucked into an LLM-generated presentation, which will be read out without comprehension and listened to without interest.
And there’s the real problem. Once we know that it’s slop, once we realise that the producer has contributed precisely nothing - not even the sweep of a critical eye - to the content, then the incentive to consume vanishes. “If you can’t be bothered to write it, then why should I be bothered to read it?” I read that somewhere this week. It is scary because it implies that some of our most necessary communication channels might grind to a halt.2 But perhaps it is also the way out: if I can’t be bothered to read it, why should they bother to generate it?
If you have some particularly noxious bullshit that you would like to share then I’d love to hear from you. DM me on substack or email me at simon@coppelia.io.

The white stuff
Have I got a treat for you. Warm your slippers, clean out your pipe and get ready to enjoy some late Victorian (or is it early Edwardian?) machine learning. By this I mean Pearson’s original 1901 paper on principal component analysis. Not that he called it that - the term ‘principal component’ is due to Hotelling, who rediscovered the process in the 1930s. Pearson’s paper is entitled On lines and planes of closest fit to systems of points in space. It begins:
In many physical, statistical, and biological investigations it is desirable to represent a system of points in plane, three, or higher dimensional space by the “best-fitting” straight line or plane.
And there it is. We would say that the best-fitting straight line is the first principal component, and the best-fitting plane is defined by the first two principal components. But other than that, it is nearly all there, and it is fascinating to see how much of modern statistical terminology and notation is already in place by 1901.
Interesting, but is there a better reason to revisit old papers than mild curiosity? I think so. I find that they are more likely to contain the original intuitions and relate to the original problems than modern textbooks. The latter have filtered out all the tangible fumblings that eventually led to the abstractions.
Pearson’s paper addresses a problem I had never really thought about, and which is ignored now in most explanations of PCA.
In nearly all the cases dealt with in the text-books of least squares, the variables on the right of our equations are treated as the independent, those on the left as the dependent variables. The result of this treatment is that we get one straight line or plane if we treat some one variable as independent, and a quite different one if we treat another variable as the independent variable.
This matters because:
In many cases of physics and biology, however, the “independent” variable is subject to just as much deviation or error as the “dependent” variable. We do not, for example, know x accurately and then proceed to find y, but both x and y are found by experiment or observation. We observe x and y and seek for a unique functional relation between them.
If we are to have a single line of best fit, then it must treat both variables as equally prone to error. And, as you have probably guessed, this line turns out to be the first principal component for points scattered across two dimensions.
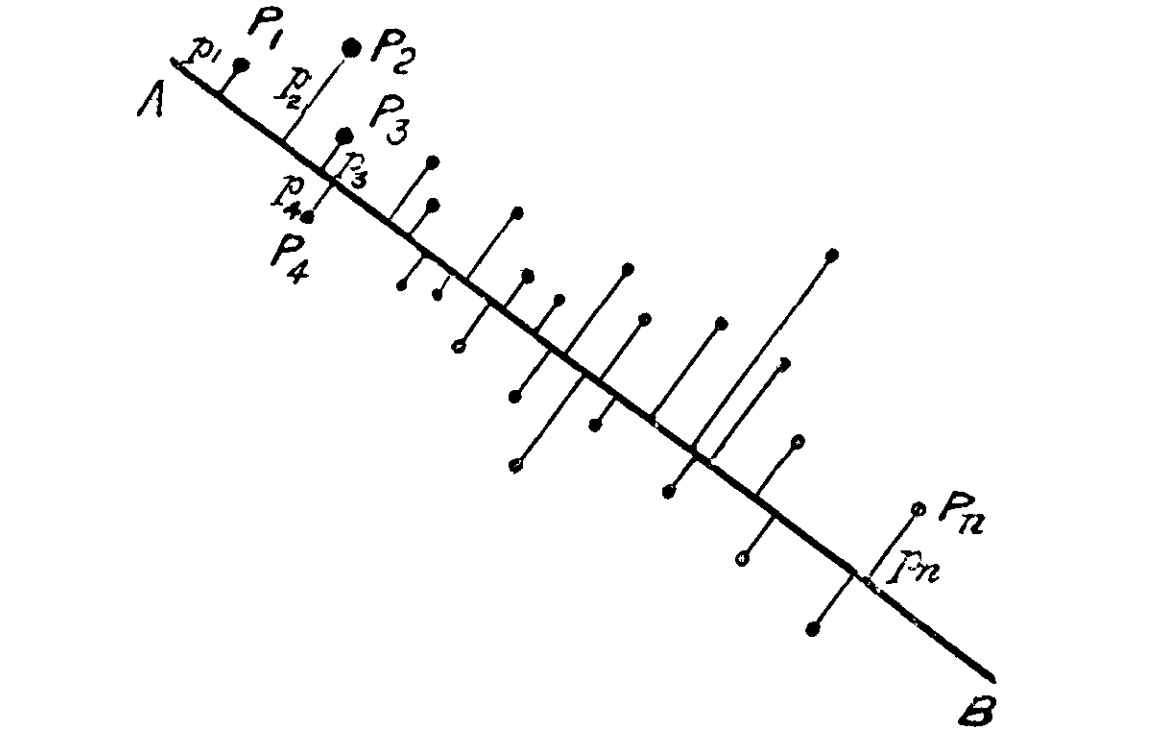
We are so conditioned to think using linear algebra that it to never occurred to me to link PCA to measurement error. It is a path that led Pearson to an “ellipsoid of residuals” where the first principal component coincides with its major axis.
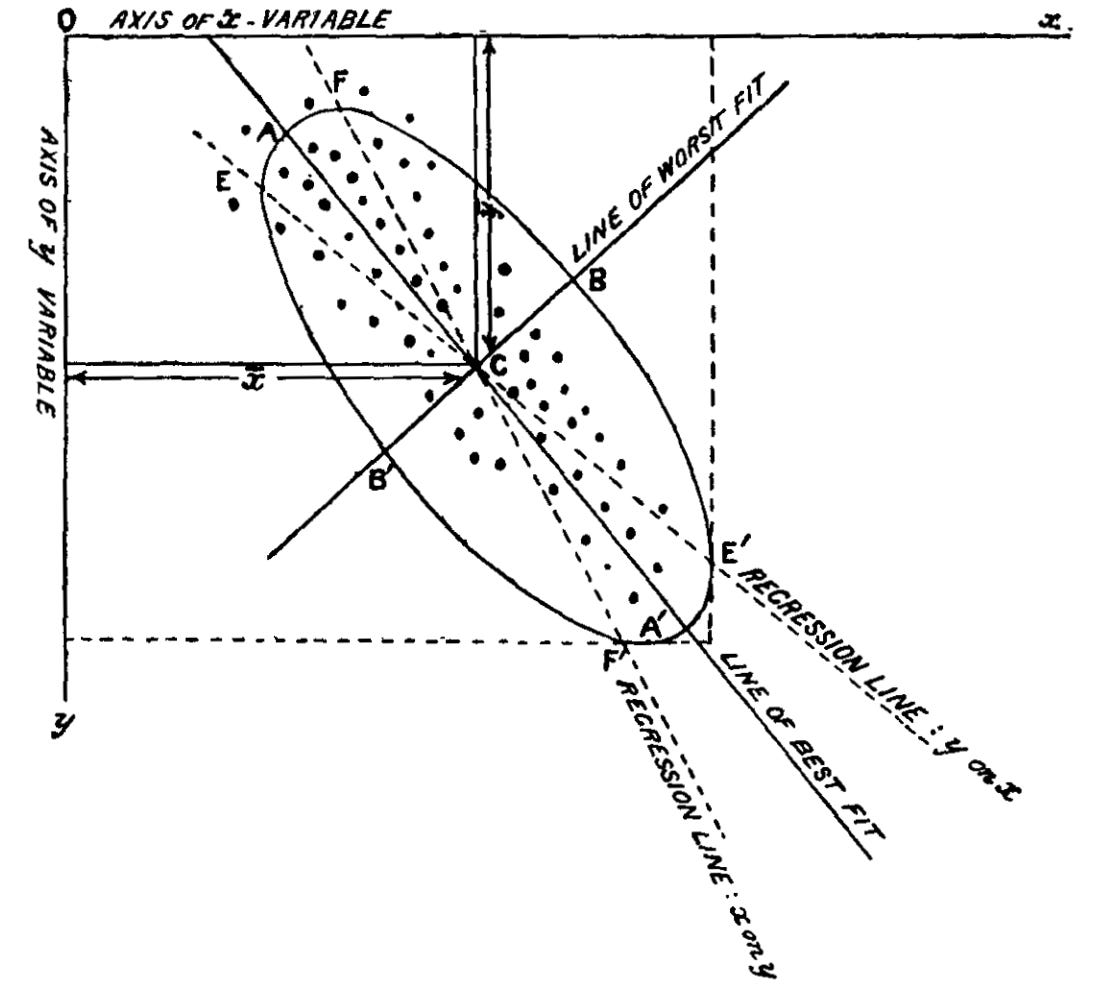
I say put the above diagram in your next presentation and inform your boss that your machine learning pipeline is cutting-edge as of 1901.

Semi-supervised
Yes, significance testing is out of fashion; yes, we are all Bayesians now (when we can be), but frequentist statistics has a long shelf life, and while it remains in stock, I know I’m going to be asked the following question: “When and why should I use a one-tailed test?” It’s a topic that has baffled students since statistics entered the mainstream curriculum in the fifties - and for a very good, very interesting reason. So I urge you, even if you have sworn never to touch another p-value, read on, since the confusion around one-tailed tests points to something deep and counterintuitive about probability theory.
Fortunately, to explain the one-tailed test, I have a nice example to hand, or rather a riddle:
Two gamblers are playing a game of chance. The first gambler rolls three dice and gets a triple six. The second gambler says, “Unbelievable! What are the chances of that? One in 216, if I’m not mistaken’. The first gambler says, ‘What do you mean? It was 50-50 that this was going to happen.” They are both right. How can that be?
To answer the riddle, we need to recognise the difference, in statistical terminology, between an outcome and an event. When we talk about the outcome of an experiment (or in this case a roll of the dice), “outcome” means precisely what we think it means - the thing that actually happens. Outcomes are mutually exclusive - the same experiment cannot have two distinct outcomes. The meaning of “event”, however, is less obvious. In probability theory, an event is a subset of the possible outcomes of an experiment. An event is either elementary, if it corresponds to just one outcome, or compound, if it corresponds to many. If the latter then we describe it using a disjunction of the outcomes: “Outcome one or outcome two or… “ Events, unlike outcomes, are not mutually exclusive.
Thus while rolling three sixes is both an outcome and an event, something like rolling three sixes or two sixes and a five is simply an event. And here we have the answer to our riddle: The second gambler is thinking of the event: all the dice come up as a six, while the first gambler is thinking of the event: the sum of the results adds up to an even number (or some other compound event with a 50% probability).
My guess is that we initially struggle with this idea for two reasons: First, we don’t like the disjunctive nature of statistical events. We are hard-wired for concrete, definite, actual and discrete occurrences, so that when anyone mentions an event, we naturally think of an outcome. Thus our minds rebel against the idea that the same outcome can be two different events.
The second reason - the one that really scuppers us, and I think gets to the heart of the problem we have grasping the difference between one and two-tailed tests - is that we appear to be able change an event merely by thinking something different. In our riddle there is nothing determining the nature of the events other than what is inside the heads of the gamblers. Were the gamblers to think the same thought then they would be in agreement about the probability.
By now I’m sure you’ve got it: a one-tailed test is different from a two-tailed test because it describes a different event (the appearance of the test-statistic in a particular tail of the distribution). The troubling thing is that we can change the results of the experiment by doing nothing more than beginning it with a different thought, i.e. a different hypothesis.
But thoughts are slippery. Fail to define and record them and they easily slide into something more convenient. A statistician who runs a one-tailed test, but then switches to a two-tailed test when observing an interesting result in the other tail, is doing exactly this. Such behaviour makes a nonsense out of any kind of statistical test. We could, for example, claim that any role of three dice was amazingly improbable by simply claiming that whatever shows up is exactly what we were testing for.
Now that we have recognised and accepted the weirdness of it all, the answer to the question “When should I use a one tailed-test?” is straightforward. Use a one-tailed test when that is the event that you are interested in, i.e. the one that matters for whatever it is that you are trying to do. If a gambler wins the jackpot on a roll of three sixes then that’s the roll that matters.
Please do send me your questions and work dilemmas. You can DM me on substack or email me at simon@coppelia.io
From Coppelia
Thanks to a forward-looking client, I was able, this month, to investigate quantum computing. We used IBM’s qiskit package and ran programs on their cloud-based quantum computers. A statistical background is helpful for the basics, although the placing of quantum bits into superposition remains head-melting. Coppelia offers a short introductory course should you happen to be curious.
If it wasn’t already a joke I think the problem of semantic leakage would deal the death blow to the idea of synthetic respondents. See Gary Marcus’s recent post for the details. If this is right then simulated ultra high net worth individuals spend their time shopping in Cash Converters, listening to Money, Money, Money and watching Who Wants to be a Millionaire.
LinkedIn is a place for odd conversations. My weirdest to date began with, “hey simon, your article in Significance on the ‘pitfalls of using averages’ really resonated. it’s the same problem in GTM - most scale with headcount instead of a better system. we built a way for experts to capture the demand their own content creates. lmk if you want a one pager.” I like it when people read my articles, but (a) I’ve no idea what GTM is and (b) this seems very much like a sales ploy. Weirder still, the one-pager was about an AI company called Valley, who specialise in identifying “warm signals” and sending “personalized outreach automatically”. This I take to mean using AI to trawl through an individual’s publications and to send them a personal message that impersonates a reader. It’s cynical, but why use it on someone (me) who you are trying to sell the service to? Perhaps to say, “Look at how effective this is. After all we got you!” But then, when I asked just this, she (if actually human) denied it. I’m lost. The upshot was that the very existence of her product made me extremely sceptical about whether she was real - which I think proves why this strategy might in the end be self-defeating.
If you’ve enjoyed this newsletter or have any other feedback, please leave a comment.
It’s worth noting that slop thrives in areas where output is already poor-quality.
I confess to a Luddite fantasy in which certain areas of bureaucracy, where the text itself is relatively pointless, are assimilated by LLMs. The LLMs end up just dealing with each other, doing things that no one really cared about in the first place. For example HR use the LLM to write instructions for a performance review; the employee and line manager use LLMs to complete it; HR use LLMs to summarise the performance review; the result is filed away. Then a product comes along claiming to write a performance review in such a way that the person is more likely to get a pay increase, then HR purchases a product to detect such products… In my fantasy this all ends magically: the internet becomes a giant Rube Goldberg machine, talking to itself but doing nothing of any importance. We run off into grassy meadows.