
Glasseye
Issue 10: February 2025
In this month’s issue:
Map your way towards concept clarity in semi-supervised.
The dunghill wonders what some high-profile experimentation platforms are doing with such wonky distributions.
We are impressed by François Chollet’s intelligent approach to intelligence in the white stuff.
Plus swapping out langchain for llamaindex, keeping a tight chain on LLMs and shushing copilot.

Semi-supervised
In the last instalment we looked at “room-tidying”: the essential clarifying and untangling work that a data scientist should carry out before tackling a difficult problem. This month we are taking a closer look at one of the techniques briefly mentioned - the surprisingly under-used art of concept mapping.
The idea is to construct a graph in which every node is a concept that features in the problem and every edge describes a relation between concepts.
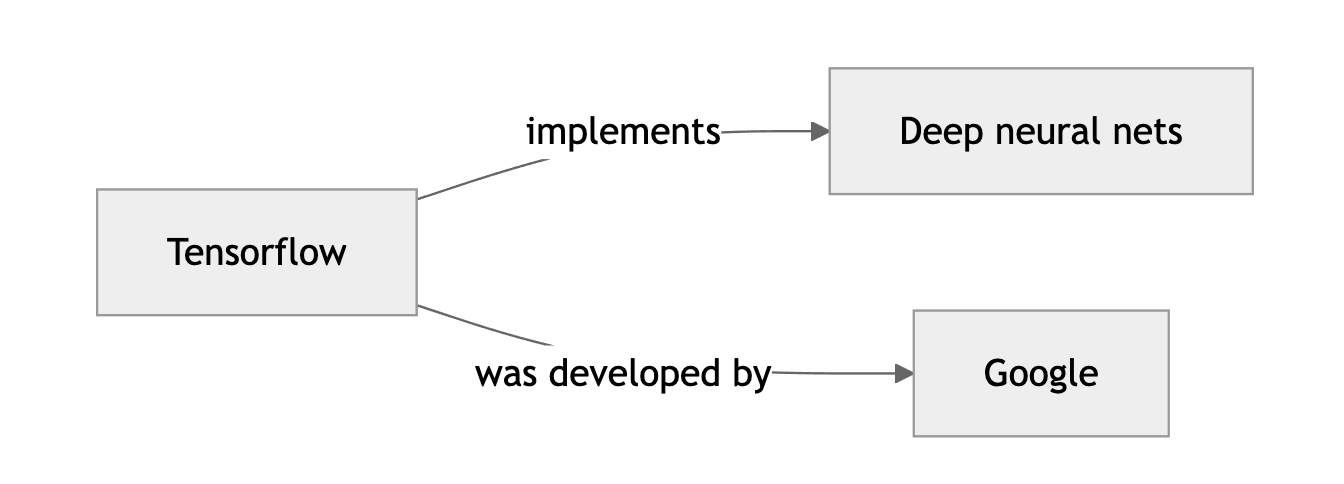
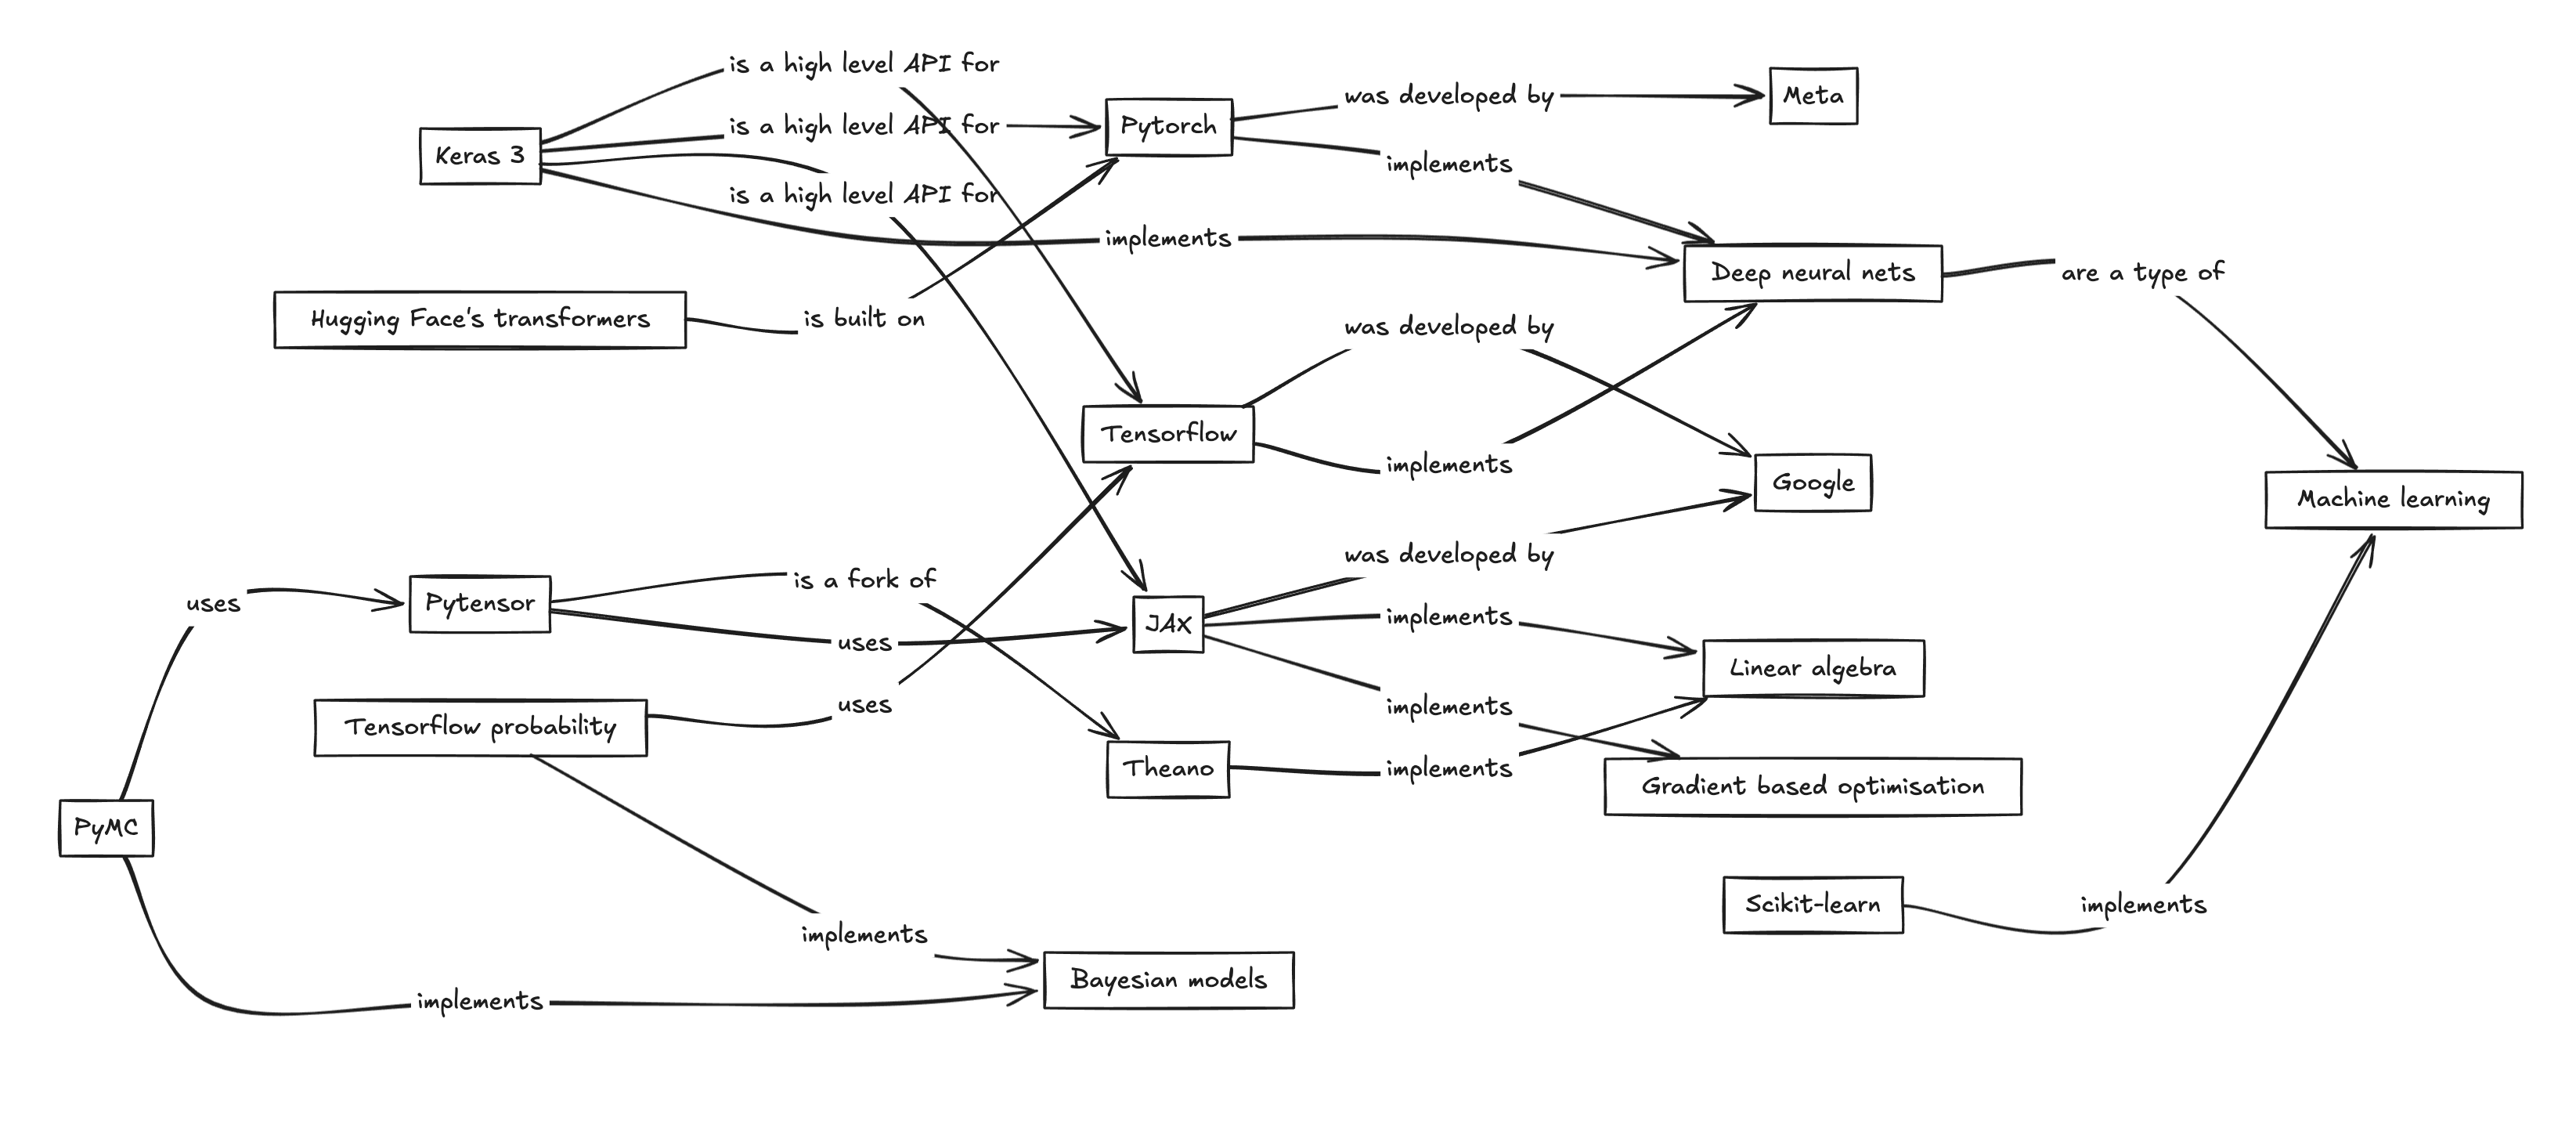
Don’t be fooled by its simplicity; this is a powerful technique. And it’s worth emphasising that a concept map is not a mind map. With the latter almost anything goes, whereas a concept map (as I do it) is tightly regulated by a single simple rule: the node-edge-node sequence of labels should form a sentence that is read in the direction of the arrow. “Tensorflow… implements… neural nets.” Sticking to this rule imposes structure on your thinking and keeps the diagram clean and clear.
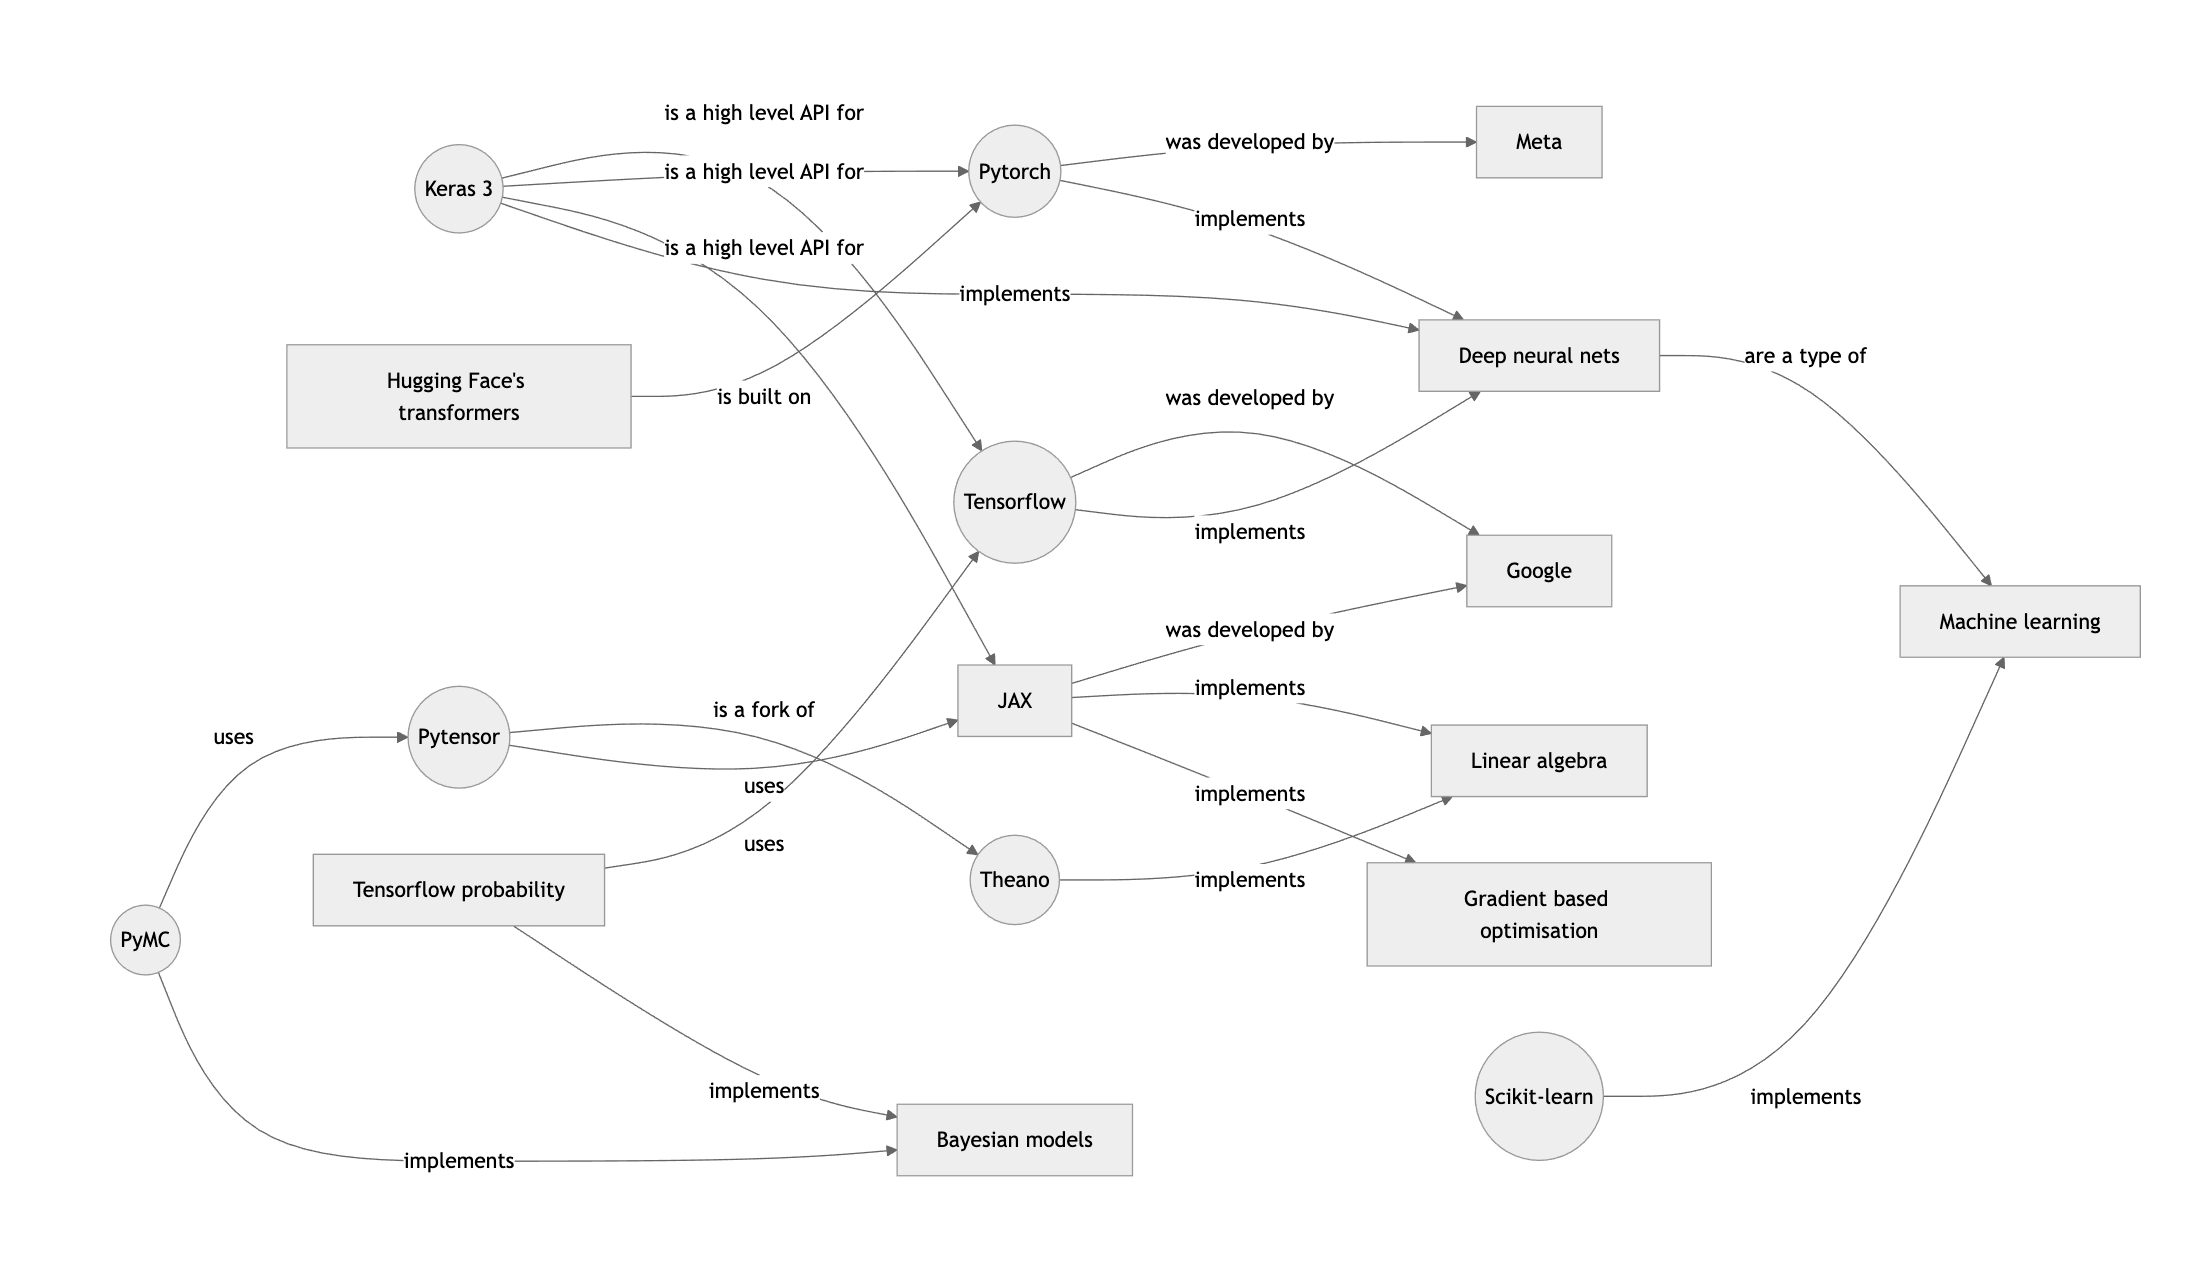
To illustrate here’s a diagram I featured in a previous post, untangling the confusing world of deep learning in Python.
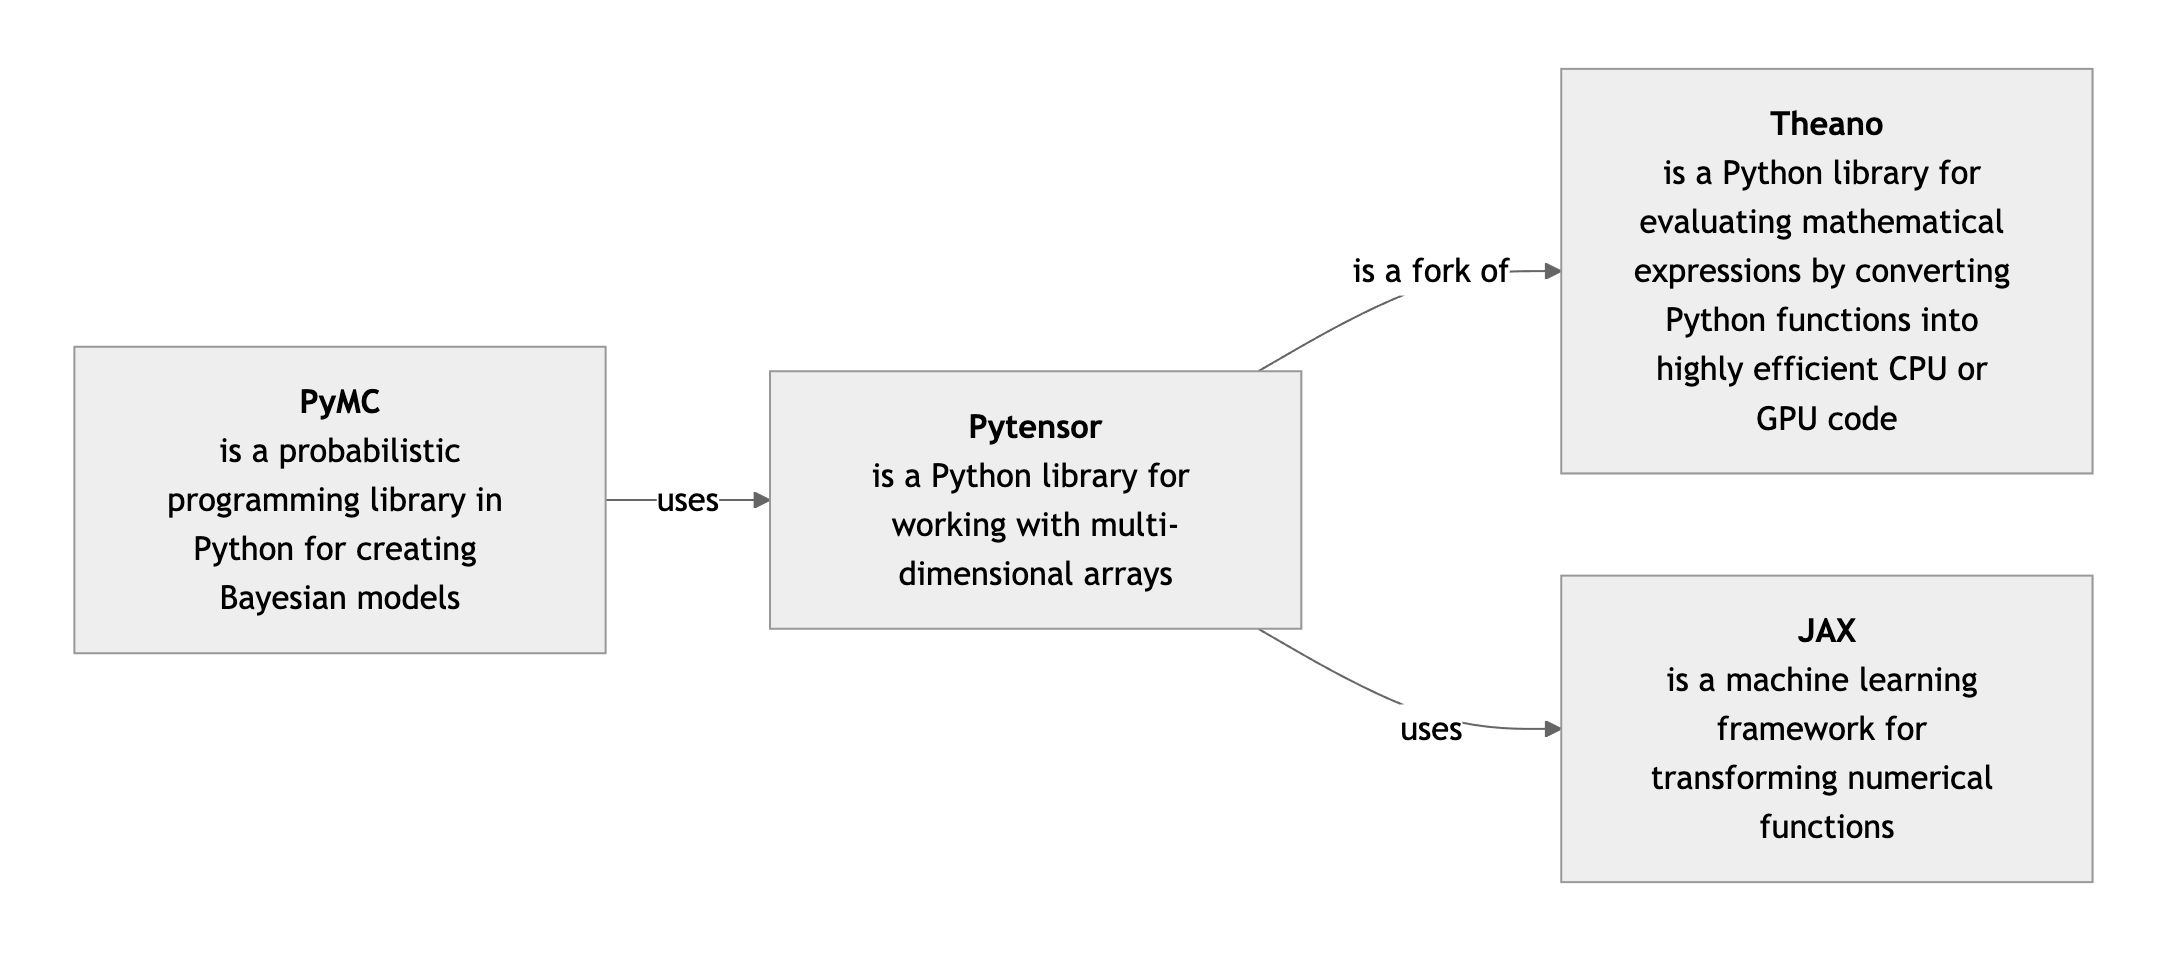
Sometimes I find it useful to include concept definitions under node labels. Obviously these definitions are independent of the other concepts in the map (else they would also feature as edges).
Adding labels for some of the more common relationship types (e.g. X is a Y”) can clutter up the map. To avoid this I borrow the standard UML arrow types for class diagrams and adopt the convention that if an edge is unlabelled then the UML rules apply.1
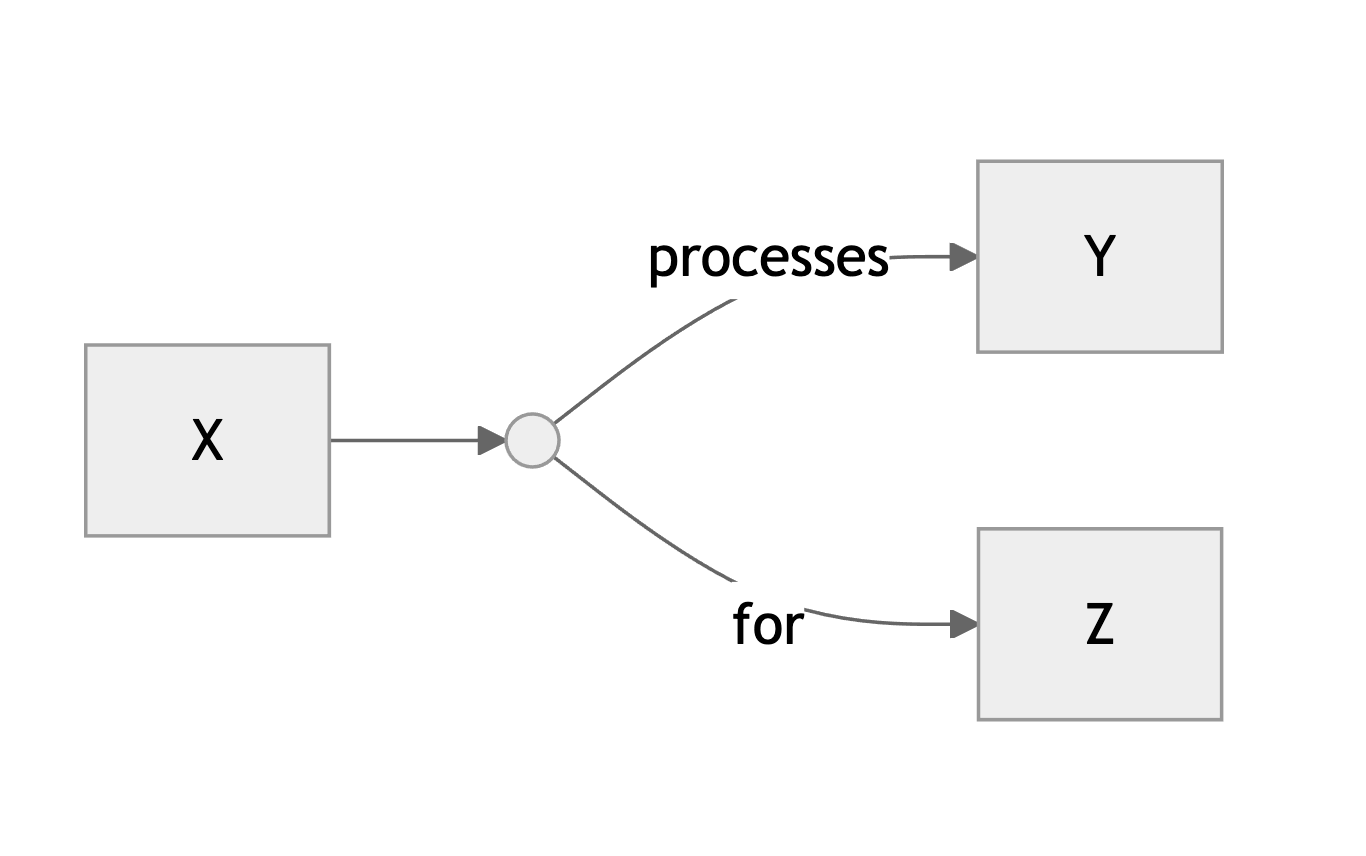
One last thing worth mentioning: it is usually possible to break down complex definitions into simple relationship pairs. For example, “Pytorch is a python library that was developed by Meta” becomes “Pytorch is a python library” and “Pytorch was developed by Meta”. But sometimes we are stuck with a relationship between three or more elements. This typically happens when the relationship takes the form of a sentence with a direct and an indirect object, such as “X processes Y for Z”. I solve this problem by introducing an extra circular node like this:
All of this is made supremely easy through the use of the diagramming syntax of Mermaid, which can be used in most markdown editors and IDEs. I don’t know which algorithm it uses to lay out the diagrams but it can achieve wonders. (The Mermaid markup for all the above diagrams can be found here - view the raw file to see the code.)
Finally, if part of your plan is to signal effortless brilliance, you can get the hand-drawn look by dropping your mermaid markup into Excalidraw.2
Please do send me your questions and work dilemmas. You can DM me on substack or email me at simon@coppelia.io.

The white stuff
If you are looking for a paper that does, for the muddled world of genAI, exactly the kind of concept clarification work described in this month’s and last month’s semi-supervised then you won’t do much better than On the Measure of Intelligence by François Chollet. It provides the rationale for Chollet’s Abstraction and Reasoning Corpus (ARC), which, for now at least, is the most generally accepted benchmark test for AGI. But it is also an object lesson in room tidying since he takes great care to straighten out the concepts before getting started on his own definition of intelligence.
Among his clarifications my favourite is his distinction between “the process of intelligence (such as the intelligence displayed by researchers creating a chess-playing program)” and “the artifact produced by this process (the resulting chess-playing program)”. The human chess player, who learns this skill from scratch, without being specifically engineered to play chess, is both the process and the artefact, with the process being the most remarkable part. Until AI is both process and artefact we are, he implies, fooling ourselves.

The dunghill
The Central Limit Theorem is a wondrous thing. One of its many gifts to us is the power to AB test sample means from two populations no matter how the population data is distributed. If we take a typically skewed metric such as income, then, with a large enough sample size, the distribution of the sample mean over many samples will be approximately normal. Conveniently, the absolute difference between two normal distributions is also normal - and this gives us the starting point of an AB test.
Which is why it is odd that anyone would choose to work with the relative difference - (A-B)/A - instead of the absolute difference A-B. But, as Sara Gaspar recently pointed out to me, this is exactly what some experimentation platforms are doing. One example is Eppo. They are not small (47 million of investment according to this post) so I hope they know what they are doing.
Their rationale for making this move is that they wish “to provide effect estimates consistently across all metric types (counts, rates, percentages, etc.)”. You can’t but sympathise with this: anything that makes communicating results easier is worth having. But what is the cost?
Commendably they give us their workings here on their website. Their justification for using relative difference is that under certain conditions the ratio of two normal distributions is approximately normal, and they cite this paper to justify the claim. Now you might think that if the absolute difference is normally distributed then the relative difference is going to be a bit wonky. And you’d be right - it can indeed be very wonky. Therefore the conditions for approximate normality are worth investigating.
A fairly typical case in A/B testing is one where we are investigating whether a proposed change in a product or a process results in the increased probability of an action. It is very common in my experience to be dealing with very small increments on what are already very low probabilities. The baseline probability might for example be 0.02 and the uplift 0.005. If the sample size is around 300 then the distribution looks like this.
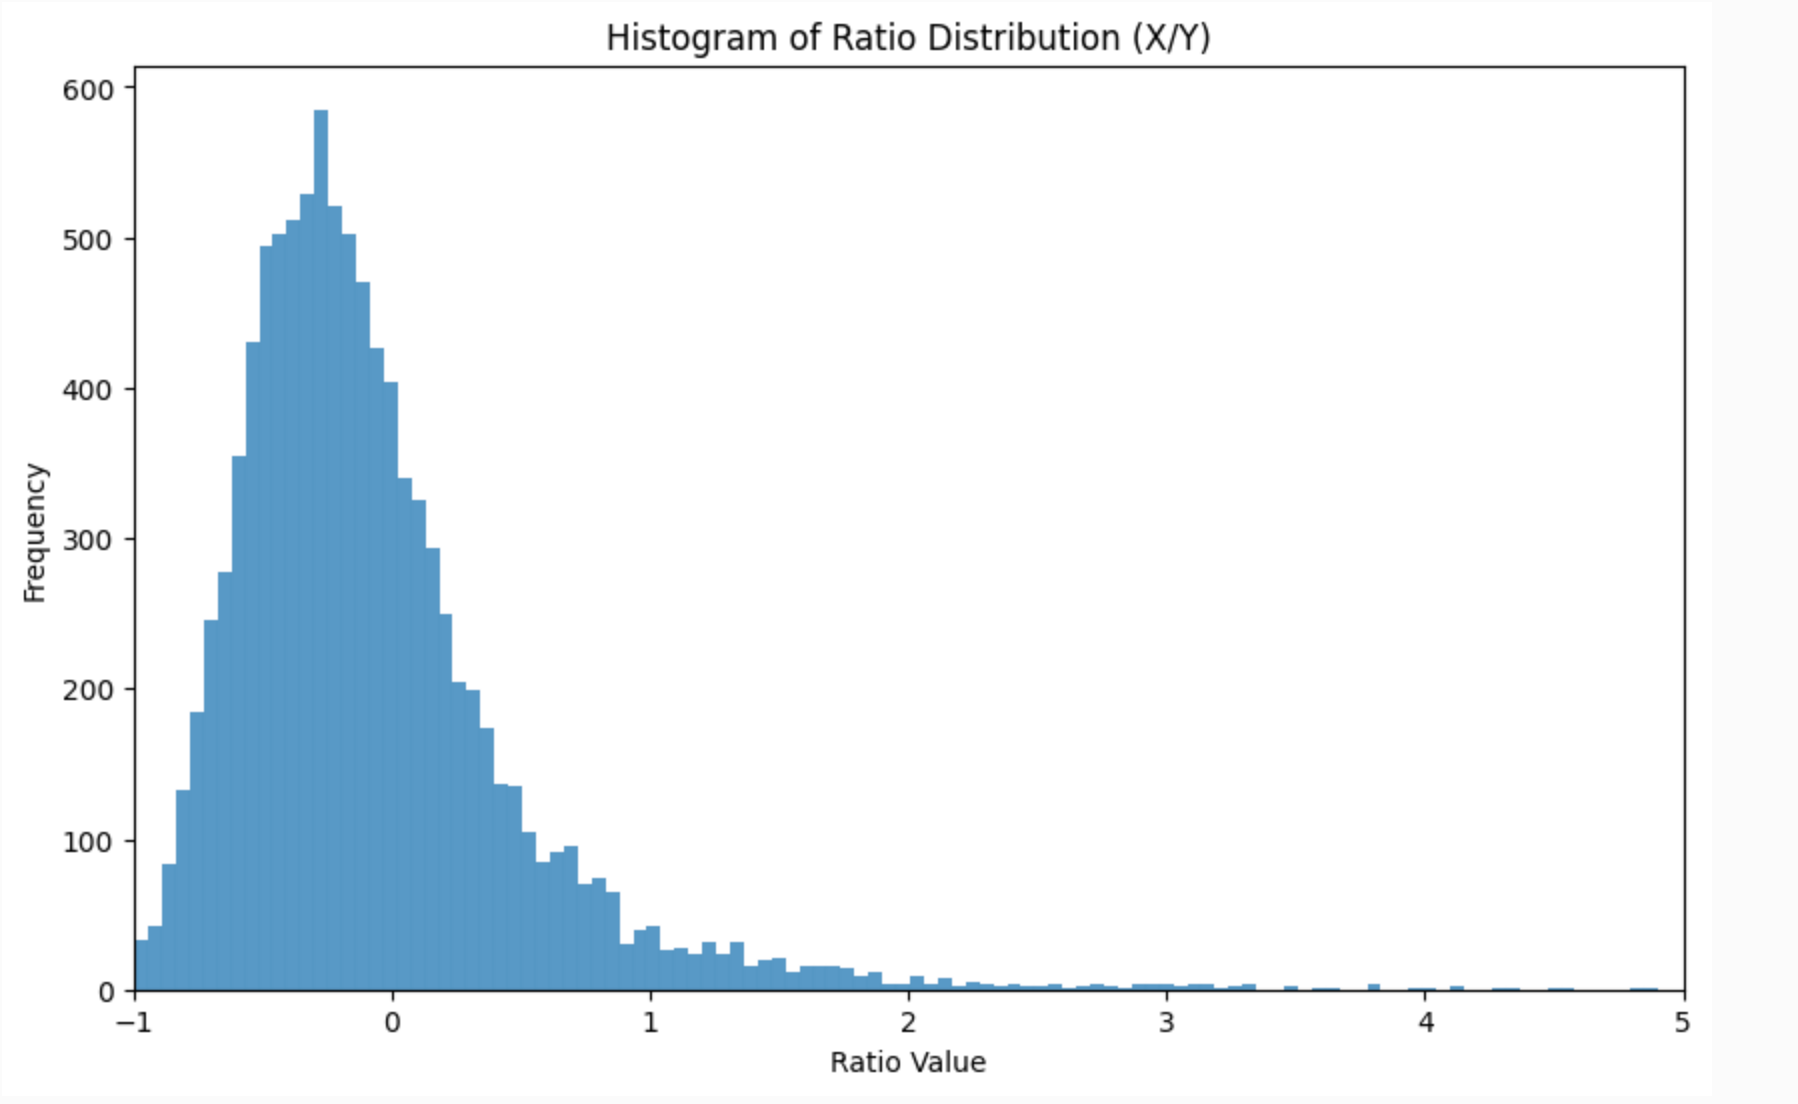
Not too normal. In fact it takes a sample of around 10k or more before it starts to look passably normal (this is in line with the conditions described in the paper). You can find the code for the simulation here.
To be fair, the documentation comes with the caveat: “If the estimate for Control is close to zero, that ratio becomes unreliable. We do not compute the relative lift when Control is less than 1.5 standard deviation around zero.” Although it’s not exactly clear what this means. 1.5 standard deviation of which distribution? If they want to ensure that the inference works then wouldn’t be better to use the bounds given in the paper.3 And if they don’t use relative lift then what do they do? Revert to absolute lift? In which case what was the point of the whole exercise?
I hope the sample size calculations on Eppo take all this into account, although I see that their formula for minimum detectable difference does not.
Either way I’m not convinced the benefits outweigh the costs in this particular case.
If you have some particularly noxious bullshit that you would like to share then I’d love to hear from you. DM me on substack or email me at simon@coppelia.io.
From Coppelia
February has been a month of heavy coding with some interesting discoveries. I’ve swapped over from Langchain to Llamaindex, on the promise that it is simpler to use and better at the straightforward data extraction tasks I’m mainly using LLMs for at the moment. So far it is living up to that promise.
I also started exploring the world of LLMOps which seems to be expanding exponentially as businesses bet on being among the first as a new sub-industry takes off. I’m still feeling sceptical about just how many use-cases there really are, but still it is interesting to see all the new monitoring and measurement frameworks out there, most of which involve LLMs monitoring LLMs (the so-called LLM as judge approach). Take a look at DeepEval.
Finally I’ve discovered the secret of working with copilot within an IDE. It’s very simple: a “shut up” shortcut key. Forget every other copilot shortcut. Toggle it on when you need help and off when you need some peace and quiet. It’s life-changing!
If you’ve enjoyed this newsletter or have any other feedback, please leave a comment.
Note you can get the UML arrow heads on concept maps in mermaid by fudging a classDiagram as shown in the code here.
The option is under AI tools in the menu bar.